Shopping cart
Hello There!
Welcome to GattPrep, your Guide for Life and Learning
Imagine a teacher wants to know how many students scored below 30 marks on a test. Looking at individual frequencies might not help, but cumulative frequency and an ogive (a special type of graph) will! 📈
In this lesson, we’ll break down how to build cumulative frequency tables, draw ogives, and use them to estimate medians and percentiles — essential tools for exams, data analysis, and everyday insights!
Let’s start with this data set:
| Marks | Frequency |
|---|---|
| 0–9 | 3 |
| 10–19 | 5 |
| 20–29 | 7 |
| 30–39 | 9 |
| 40–49 | 6 |
Now add the cumulative frequency column:
| Class Interval | Frequency | Cumulative Frequency |
|---|---|---|
| 0–9 | 3 | 3 |
| 10–19 | 5 | 8 |
| 20–29 | 7 | 15 |
| 30–39 | 9 | 24 |
| 40–49 | 6 | 30 |
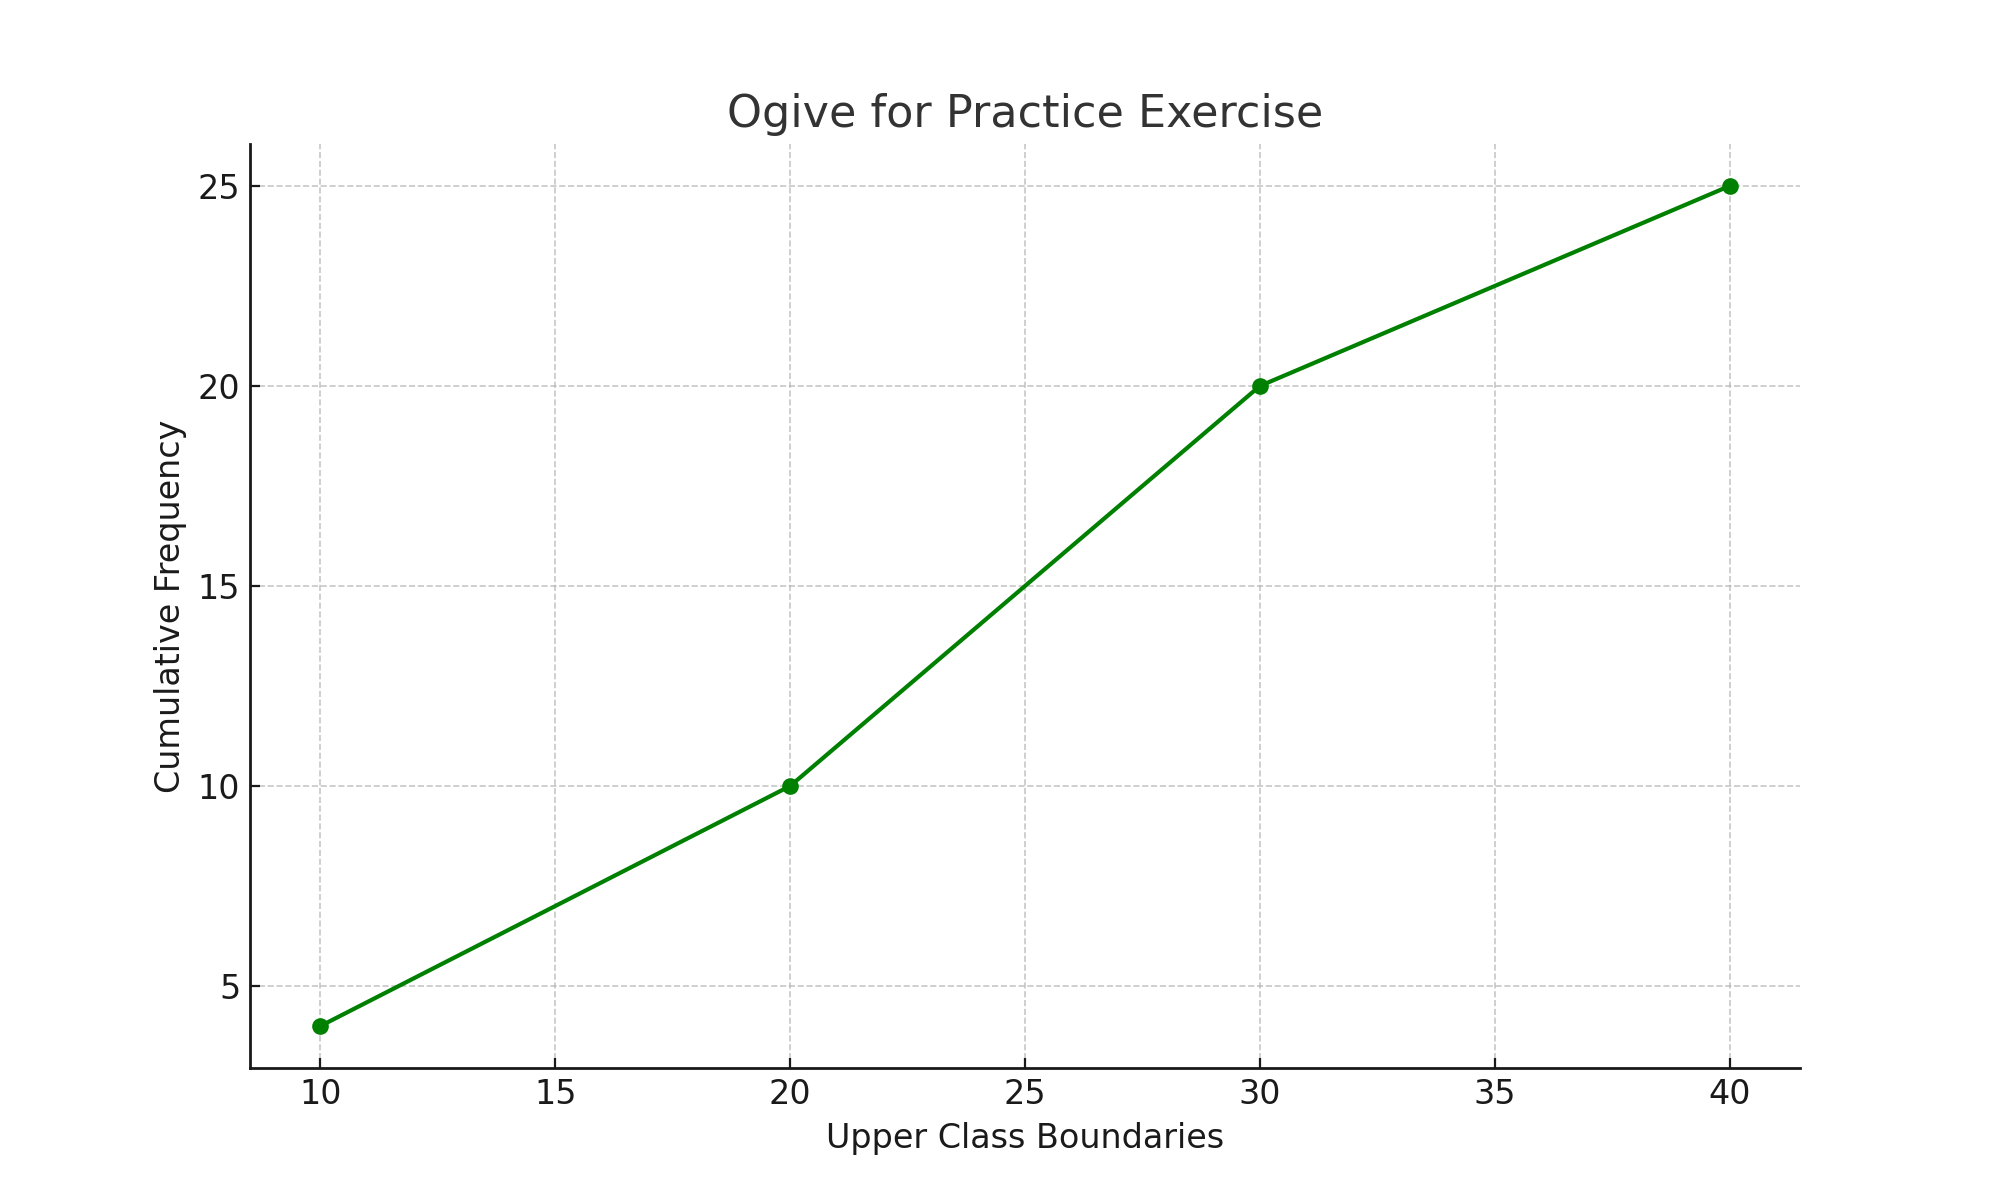
Ogive Graph for This Example:

| Class Interval | Frequency | Cumulative Frequency |
|---|---|---|
| 0–10 | 4 | ? |
| 10–20 | 6 | ? |
| 20–30 | 10 | ? |
| 30–40 | 5 | ? |
Practice Ogive Graph:

If you recorded your study time in weekly ranges (e.g. 0–1 hr, 2–3 hrs…), how could you use an ogive to see how many days you studied more than 3 hours?