Shopping cart
Hello There!
Welcome to GattPrep, your Guide for Life and Learning
Have you ever seen a straight road or a curved rollercoaster? In mathematics, we describe those shapes using graphs of functions 📈.
This lesson will teach you how to draw and interpret linear (straight-line) and quadratic (parabola-shaped) graphs. These graphs help us model and solve real-life problems like motion, cost, and design.
By the end of this lesson, you’ll be able to:
Linear functions have the form:
Where:
Graph is a straight line.
Quadratic functions have the form:
The graph is a curve called a parabola:
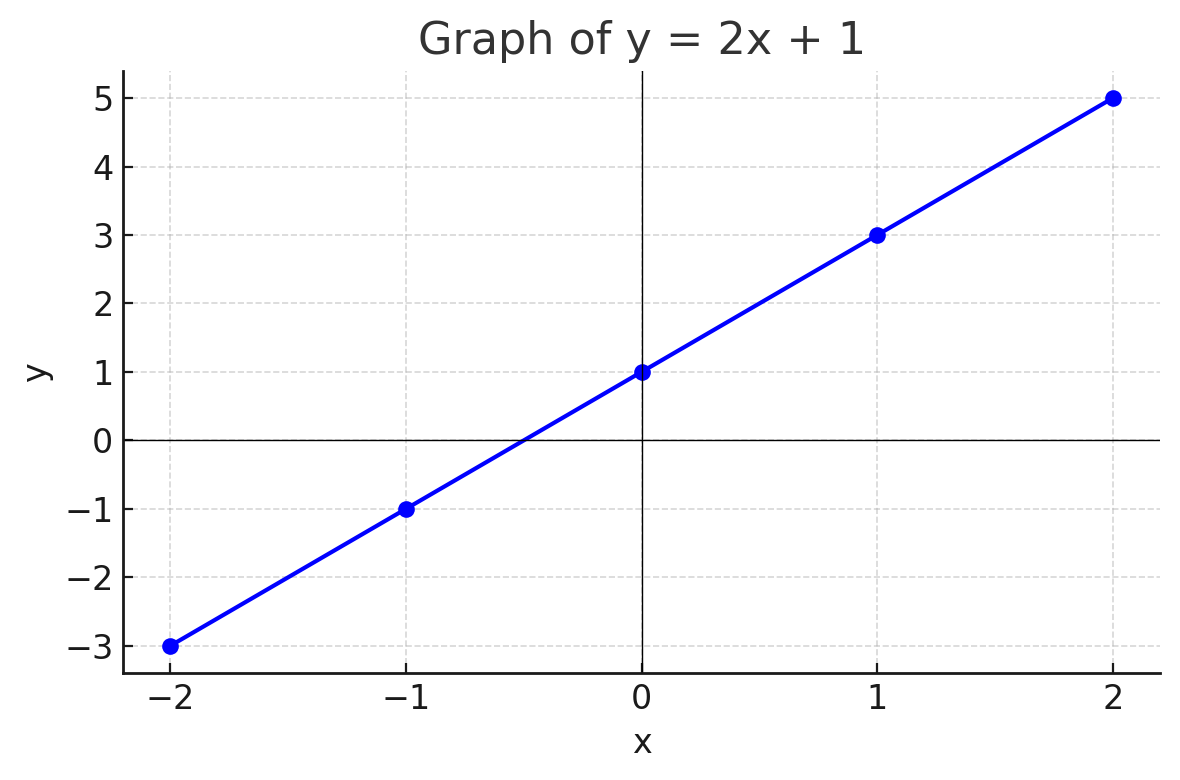
x | -2 | -1 |  0 |  1 |  2
y | -3 | -1 |  1 |  3 |  5
Plot the points and draw a straight line through them.

x | -1 |  0 |  1 |  2 |  3 | 4
y |  6 | -3 | -4 | -3 |  0 | 5
Plot the points and draw a smooth U-shaped curve.

Roots: x = 3 and x = -1 (where y = 0)
Turning Point: At x = 1, y = -4
Axis of Symmetry: x = 1
If a business’s profit graph is a parabola, what might the turning point represent? Why would it be important to find it?